Tautochrone_curve.gif(300 × 200 pikseļi, faila izmērs: 102 KB, MIME tips: image/gif, looped, 80 kadri, 3,2 s)

Kopsavilkums

Apraksts

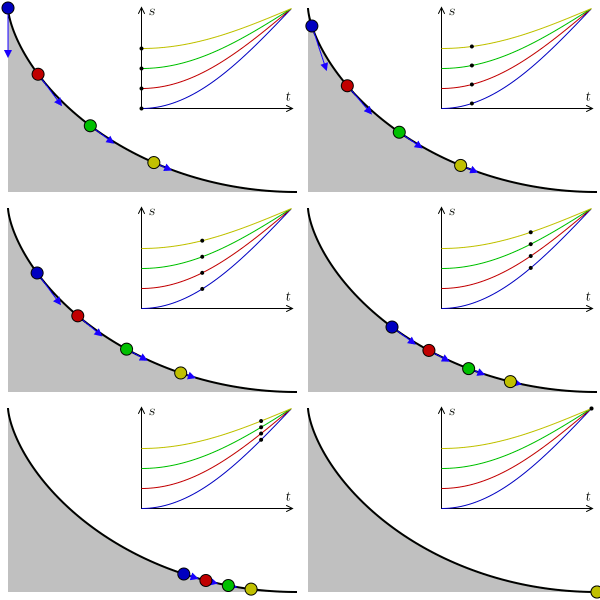
A tautochrone curve is the curve for which the time taken by an object sliding without friction in uniform gravity to its lowest point is independent of its starting point. Here, four points at different positions reach the bottom at the same time.


In the graphic, s represents arc length, t represents time, and the blue arrows represent acceleration along the trajectory. As the points reach the horizontal, the velocity becomes constant, the arc length being linear to time.
Datums 2007. gada 9. maijs; new version 2009. gada augusts
Avots Paša darbs
Autors

Claudio Rocchini

rewritten by Geek3
GIF veidošana
InfoField
 
This plot was created with Matplotlib.
Pirmkods
InfoField

Python code

#!/usr/bin/python
# -*- coding: utf8 -*-

'''
animation of balls on a tautochrone curve
'''

import os
import numpy as np
import matplotlib.pyplot as plt
import matplotlib.patches as patches
from matplotlib import animation
from math import *

# settings
fname = 'Tautochrone curve'
width, height = 300, 200
nframes = 80
fps=25

balls = [
{'a':1.0, 'color':'#0000c0'},
{'a':0.8, 'color':'#c00000'},
{'a':0.6, 'color':'#00c000'},
{'a':0.4, 'color':'#c0c000'}]

def curve(phi):
    x = phi + sin(phi)
    y = 1.0 - cos(phi)
    return np.array([x, y])

def animate(nframe, empty=False):
    t = nframe / float(nframes - 1.)
    
    # prepare a clean and image-filling canvas for each frame
    fig = plt.gcf()
    fig.clf()
    ax_canvas = plt.gca()
    ax_canvas.set_position((0, 0, 1, 1))
    ax_canvas.set_xlim(0, width)
    ax_canvas.set_ylim(0, height)
    ax_canvas.axis('off')
    
    # draw the ramp
    x0, y0 = 293, 8
    h = 182
    npoints = 200
    points = []
    for i in range(npoints):
        phi = i / (npoints - 1.0) * pi - pi
        x, y = h/2. * curve(phi) + np.array([x0, y0])
        points.append([x, y])
    
    rampline = patches.Polygon(points, closed=False, facecolor='none',
                       edgecolor='black', linewidth=1.5, capstyle='butt')
    points += [[x0-h*pi/2, y0], [x0-h*pi/2, y0+h]]
    
    ramp = patches.Polygon(points, closed=True, facecolor='#c0c0c0', edgecolor='none')
    
    # plot axes
    plotw = 0.5
    ax_plot = fig.add_axes((0.47, 0.46, plotw, plotw*2/pi*width/height))
    ax_plot.set_xlim(0, 1)
    ax_plot.set_ylim(0, 1)
    for b in balls:
        time_array = np.linspace(0, 1, 201)
        phi_pendulum_array = (1 - b['a'] * np.cos(time_array*pi/2))
        ax_plot.plot(time_array, phi_pendulum_array, '-', color=b['color'], lw=.8)
    ax_plot.set_xticks([])
    ax_plot.set_yticks([])
    ax_plot.set_xlabel('t')
    ax_plot.set_ylabel('s')
    
    ax_canvas.add_patch(ramp)
    ax_canvas.add_patch(rampline)
    
    for b in balls:
        # draw the balls
        phi_pendulum = b['a'] * -cos(t * pi/2)
        phi_wheel = 2 * asin(phi_pendulum)
        phi_wheel = -abs(phi_wheel)
        x, y = h/2. * curve(phi_wheel) + np.array([x0, y0])
        ax_canvas.add_patch(patches.Circle((x, y), radius=6., zorder=3,
                            facecolor=b['color'], edgecolor='black'))
        ax_plot.plot([t], [1 + phi_pendulum], '.', ms=6., mec='none', mfc='black')
        
        v = h/2. * np.array([1 + cos(phi_wheel), sin(phi_wheel)])
        vnorm = v / hypot(v[0], v[1])
        # in the harmonic motion, acceleration is proportional to -position
        acc_along_line = 38. * -phi_pendulum * vnorm
        ax_canvas.arrow(x, y, acc_along_line[0], acc_along_line[1],
                 head_width=6, head_length=6, fc='#1b00ff', ec='#1b00ff')

fig = plt.figure(figsize=(width/100., height/100.))
print 'saving', fname + '.gif'
#anim = animation.FuncAnimation(fig, animate, frames=nframes)
#anim.save(fname + '.gif', writer='imagemagick', fps=fps)

frames = []
for nframe in range(nframes):
    frame = fname + '_{:02}.png'.format(nframe)
    animation.FuncAnimation(fig, lambda n: animate(nframe), frames=1).save(
        frame, writer='imagemagick')
    frames.append(frame)

# assemble animation using imagemagick, this avoids dithering and huge filesize
os.system('convert -delay {} +dither +remap -layers Optimize {} "{}"'.format(
    100//fps, ' '.join(['"' + f + '"' for f in frames]), fname + '.gif'))
for frame in frames:
    if os.path.exists(frame):
        os.remove(frame)

Licence

Es, šī darba autortiesību īpašnieks, publicēju to saskaņā ar šīm licencēm:
GNU head Ir dota atļauja kopēt, izplatīt un/vai pārveidot šo dokumentu saskaņā ar GNU brīvās dokumentācijas licences, versijas 1.2 vai jebkuras vēlākas versijas, ko publiskojis Brīvās programmatūras fonds nosacījumiem; bez nemainīgajām sadaļā, priekšējā un aizmugurēja'vāka tekstiem. Licences kopija ir iekļauta sadaļā ar nosaukumu GNU brīvās dokumentācijas licence.
w:en:Creative Commons
atsaucoties nemainot licenci
Šis fails tiek izplatīts saskaņā ar licences Creative Commons Atsauce-Līdzīgi Noteikumi 3.0 Vispārējiem noteikumiem.
Jūs varat brīvi:
  • koplietot – kopēt, izplatīt un pārraidīt darbu
  • remiksēt – pielāgot darbu
Saskaņā ar šādiem nosacījumiem:
  • atsaucoties – Tev ir jānorāda autors, saite uz licenci un to, vai veiktas kādas izmaiņas. To var darīt jebkādā saprātīgā veidā, bet ne tādā, kas norādītu, ka licencētājs atbalsta tevi vai veidu, kā tu izmanto šo darbu.
  • nemainot licenci – Ja tu miksē, pārveido vai izmanto materiālu, tev savs devums jāpublicē ar to pašu vai saderīgu licenci kā oriģināls.
This licensing tag was added to this file as part of the GFDL licensing update.
w:en:Creative Commons
atsaucoties
Šis fails tiek izplatīts saskaņā ar licences Creative Commons Atsauce 2.5 Vispārējiem noteikumiem.
Jūs varat brīvi:
  • koplietot – kopēt, izplatīt un pārraidīt darbu
  • remiksēt – pielāgot darbu
Saskaņā ar šādiem nosacījumiem:
  • atsaucoties – Tev ir jānorāda autors, saite uz licenci un to, vai veiktas kādas izmaiņas. To var darīt jebkādā saprātīgā veidā, bet ne tādā, kas norādītu, ka licencētājs atbalsta tevi vai veidu, kā tu izmanto šo darbu.
Jūs varat izvēlēties licenci pēc jūsu vēlmes.

Captions

Pievieno vienas rindiņas aprakstu, ko šis fails attēlo

Šajā failā attēlotais

attēlo

9 maijs 2007

image/gif

Faila hronoloģija

Uzklikšķini uz datums/laiks kolonnā esošās saites, lai apskatītos, kā šis fails izskatījās tad.

Datums/LaiksAttēlsIzmēriDalībnieksKomentārs
tagadējais2009. gada 1. augusts, plkst. 16.152009. gada 1. augusts, plkst. 16.15 versijas sīktēls300 × 200 (102 KB)Geek3new physically correct version
2007. gada 9. maijs, plkst. 09.562007. gada 9. maijs, plkst. 09.56 versijas sīktēls300 × 200 (602 KB)Rocchini{{Information |Description=Tautochrone curve animation (4 points runs over a cycloid) |Source=Own work |Date=2007-05-09 |Author=Claudio Rocchini |Permission=CC-BY 2.5 }}

Šo failu izmanto šajā 1 lapā:

Globālais faila lietojums

Šīs Vikipēdijas izmanto šo failu: